
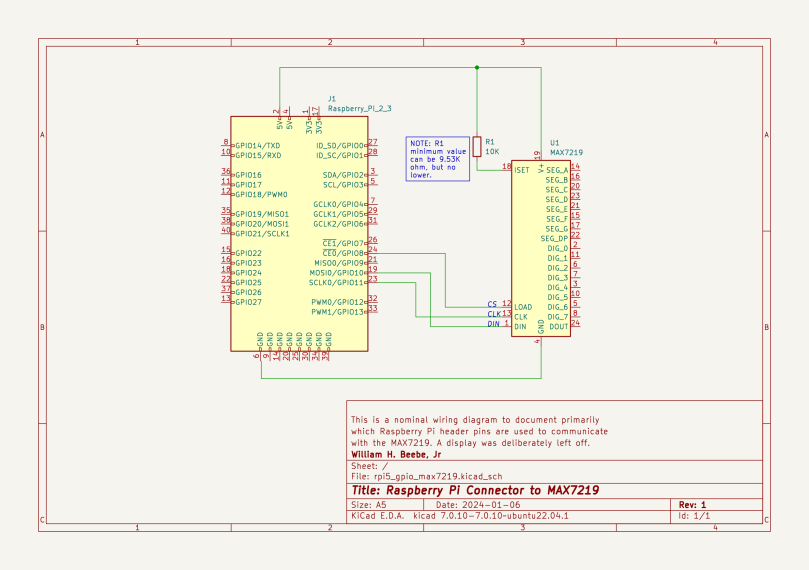
As one of my informal new years resolutions, I’ve been using KiCad 7 to document how I wire various components together, to then use those wiring schematics to generate a high quality web-viewable PNG image. It’s not that hard, but the workflow isn’t intuitive either. I’m using a circuit diagram I will be using in another post to illustrate what I’m doing with the Raspberry Pi 5, but for this post I’m documenting how I created it.
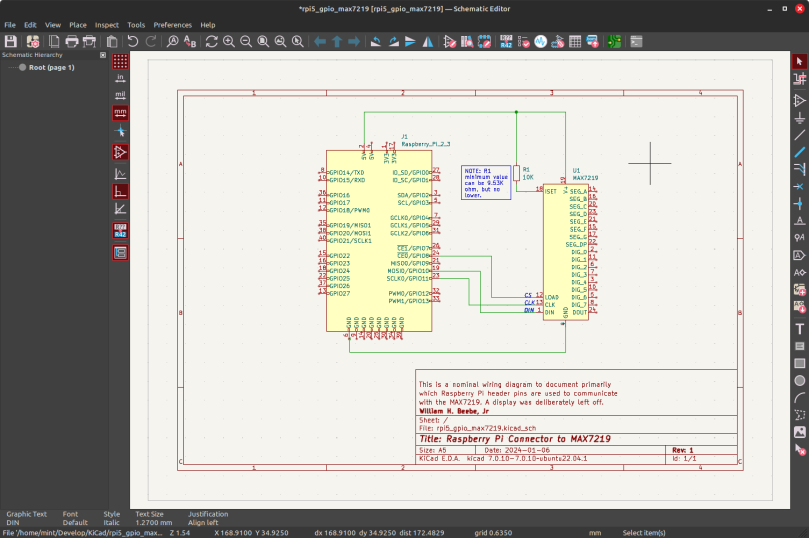
You’re viewing the KiCad schematic editor. I’ve finished my simple circuit diagram, and I’m ready to create an image to publish on the web. To do that, I need to create a plot. That happens by clicking the plotter symbol on the editor. The plotter symbol is five in from the left edge, just to the right of the printer symbol. When I click that symbol I get the following.
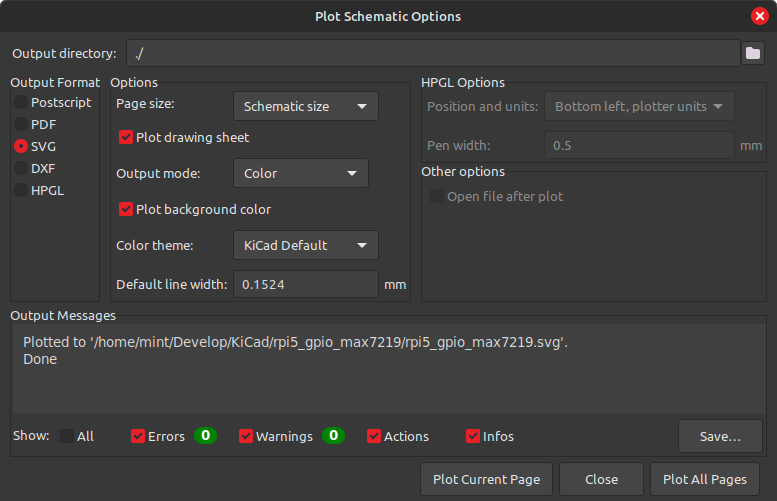
That’s how KiCad is set up to create a plot file in SVG (scalable vector graphics) format, a textual XML-based markup language that describes how to create that drawing/plot in another application. I choose color and plot background color because any other combination produces bare lines with no backgrounds, and to be honest, it looks bad. Go with color for this.
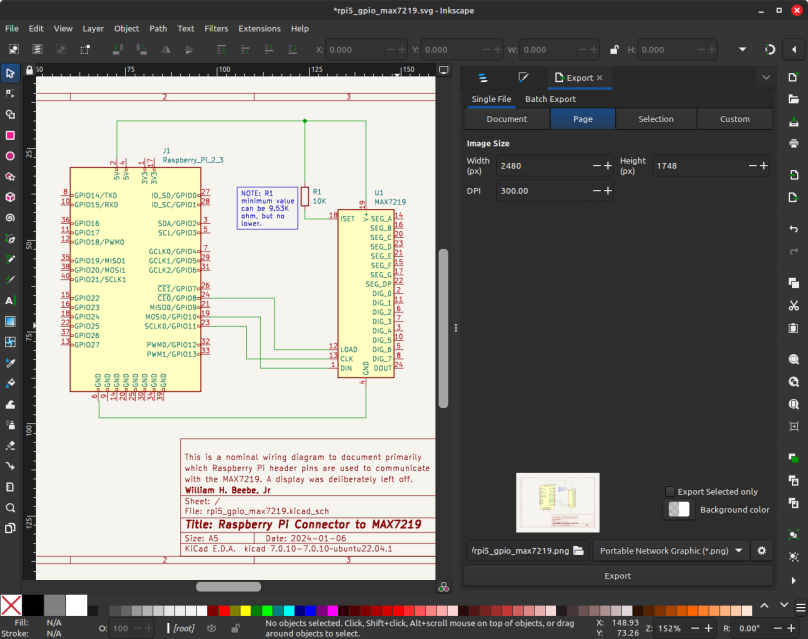
The final step is to open the SVG plotter file into Inkscape and then export it as a PNG. After opening the file in Inkscape, click the Export tab on the far right. Select export to PNG, then up on the DPI field enter 300. The default is 96 DPI which produces a small PNG file with poor detail. Going to 300 DPI produces a file that looks excellent with plenty of sharp, clean lines and detail all around. After clicking the Export button at the bottom right you can close Inkscape. Inkscape will ask if you want to save changes; just exit without saving.
All of this was performed on my regular Linux Mint computer, the MinisForum UM250. It would be interesting to see if this could be done completely on a Raspberry Pi 5.

You must be logged in to post a comment.