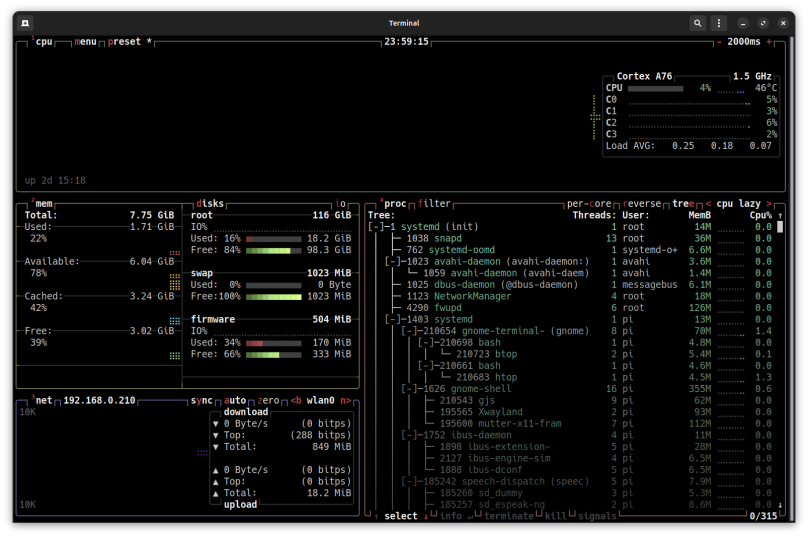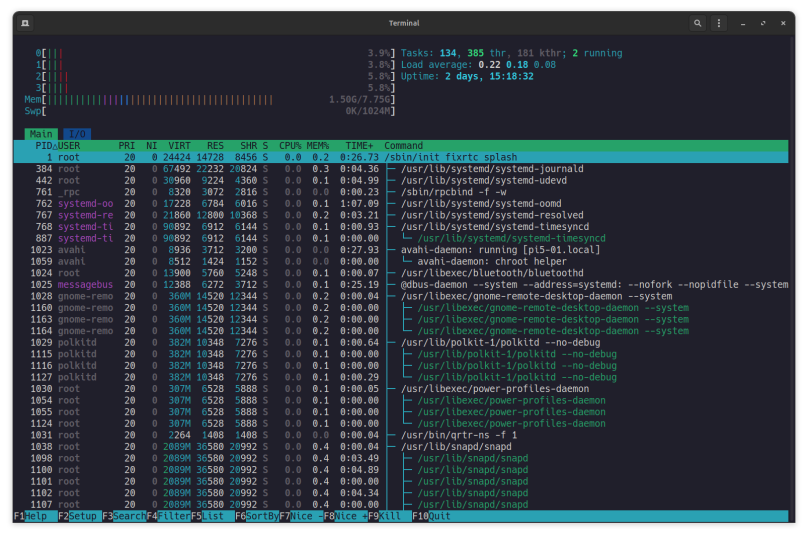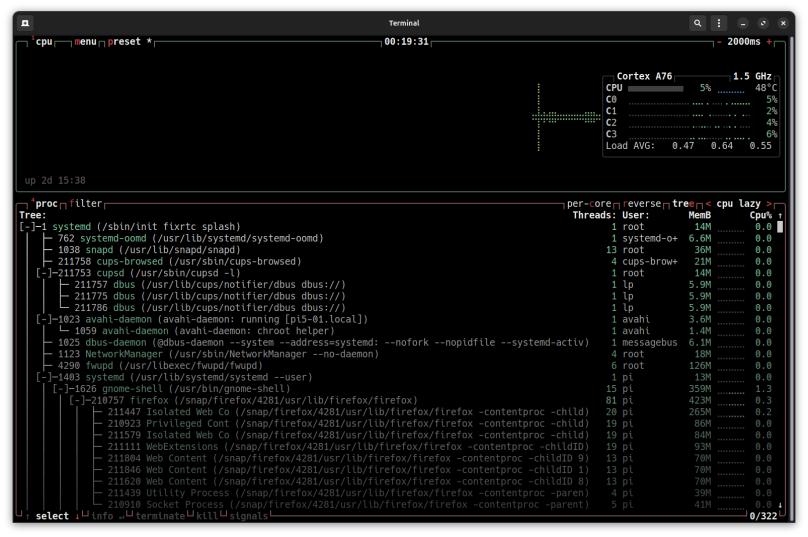
There are all sorts of system monitoring tools available for every operating system that has a reasonable presence. I’ve already written about the GUI default shipped with Ubuntu, System Monitor. I like that tool and tend to use it whenever possible, especially when I’m able to sit locally in front of the computer. But if I have to SSH into the system, there are just two text-based tools I turn to, btop and htop.

htop is a descendent of the process monitor top, where the author(s) of htop added colored text to help read what it’s presenting on the screen. I can remember having a hard time trying to keep track of the table of tasks in top, especially late at night (i.e. third shift) when I was tired and trying to stay away. When I first encounted htop I glomed to it like there was no tomorrow and never looked back at original top. I always made sure to install it on every system I was responsible for. With htop I put the task view in tree mode and then just leave it that way in a window to keep tabs on a system’s performance.
btop is more recent, and attempts to provide a more denser, detailed view of a system’s operation and performance. One key feature is that btop will show a time track of various performance metrics. For example, at the top, btop will show not just what the load on each core is, but it will show a unified view of system load from right over left in time. This can be quite useful when you want to know how long a system was under load, not just how much a load a system is in at a given point in time. The same holds true for memory, disk, and network load. In a way it’s a text version of the GUI System Monitor. The problem is that the amount of information can be overwhelming, even if it is colored text you’re reading. A lot of times I toggle off memory (which includes the disk activity) and networking, so that it looks a lot like htop, but with time data.

I wish in a way that I could combine btop’s CPU view with htop’s process view, because I’m just more used to how htop presents process information. For my personal use I prefer htop for monitoring and management over btop, but I know a lot of folk who prefer btop. Which is good, as choice is always good. As for a personal recommendation I make none at all. If I make any kind of recommendation it is to try them both (or all the others not mentioned) and then make a personal decision. None of them are bad at all.

You must be logged in to post a comment.